

Grafana dashboards are powerful visualization tools that provide insights into complex data sets with clarity and efficiency.
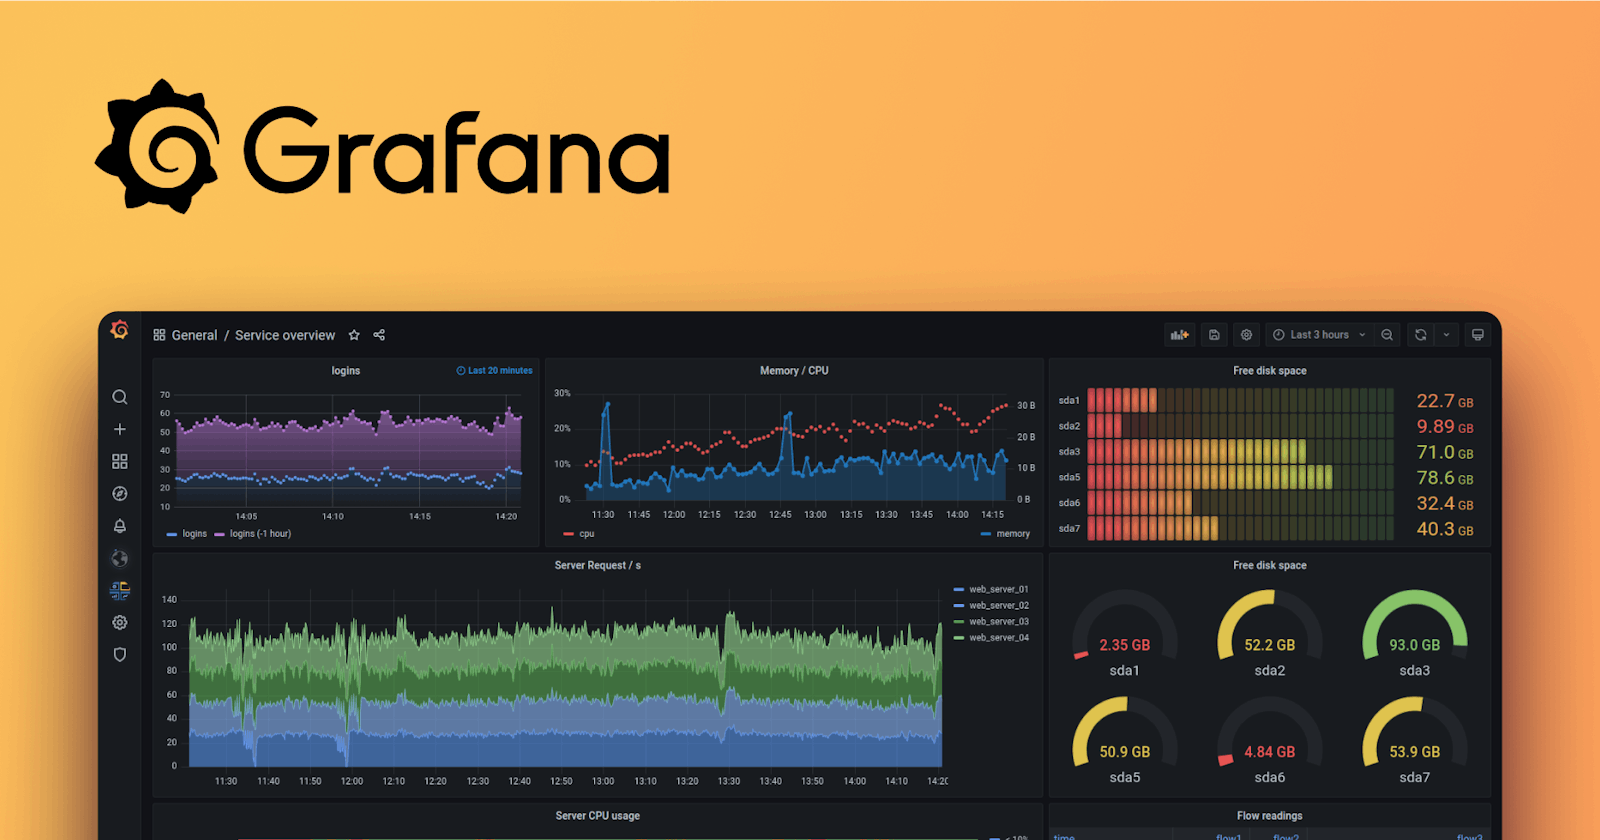
With Grafana, users can create customized dashboards that display real-time metrics, logs, and other data sources in a visually appealing and interactive format.
These dashboards offer a comprehensive view of system performance, allowing users to monitor key metrics, detect trends, and troubleshoot issues quickly. Whether you're managing infrastructure, analyzing business metrics, or monitoring IoT devices, Grafana dashboards provide the flexibility and functionality needed to visualize data and make informed decisions.
You can certainly create a Grafana dashboard from the scratch, however, chances are there is already a template available for your use case, and if it is not 100% as you need it to be, it can be customized further.
There are templates for just about anything, check them out at the Grafana Dashboards